AI Meets Earth Observation: The High-Tech Blueprint for Disease Outbreak Prediction
Discover how machine learning and Earth observation (EO) data are transforming public health forecasting. This in-depth guide walks you through the high-tech process of predicting disease outbreaks, such as malaria and cholera, using satellite imagery, environmental variables, and AI models. Learn how to collect and process EO and demographic data, train machine learning algorithms, and interpret results to inform proactive health interventions. Ideal for researchers, data scientists, and public health professionals, this article explores scalable applications of AI in public health, including urban heat mapping, food security, disaster preparedness, and infrastructure equity. Unlock the potential of satellite data and predictive modeling to build a healthier, more resilient future.
TECH FOR PUBLIC HEALTHSCIENTIFIC INSIGHTS INTO AI AND GEOSPATIAL TECHNOLOGIES
Scott Pezanowski
6/30/20256 min read

In an era where climate change is altering weather patterns and disrupting ecosystems, diseases such as malaria and cholera are expanding their territories. Rising temperatures and fluctuating rainfall can rapidly transform disease dynamics. Fortunately, advances in artificial intelligence (AI) and Earth observation (EO) data offer powerful tools to help us stay ahead. Imagine predicting where and when disease outbreaks will occur, just like we forecast the weather. This isn’t just possible; it’s already happening.
I walk you through the process of using machine learning and satellite-based Earth observation to forecast disease outbreaks, explaining how it works and why it matters. Whether you’re in public health, data science, policymaking, or simply curious, this insight could change how you think about the future of healthcare and environmental monitoring.
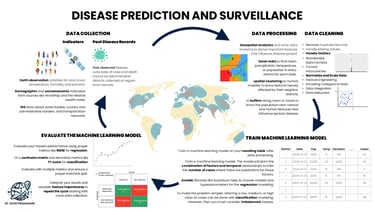
Step 1: Gathering the Right Data
Everything begins with high-quality data. The more complete and accurate it is, the better your predictions will be.
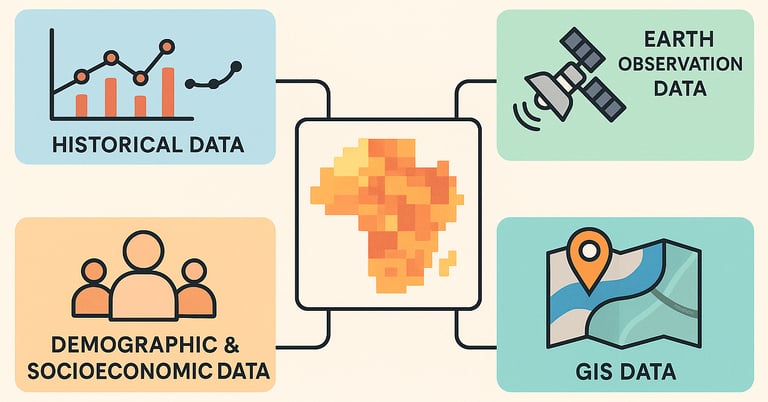
We typically start with historical records of disease outbreaks. For diseases like malaria or cholera, these are often weekly or monthly case counts recorded at the district or local level. This historical data forms the backbone of our prediction models.
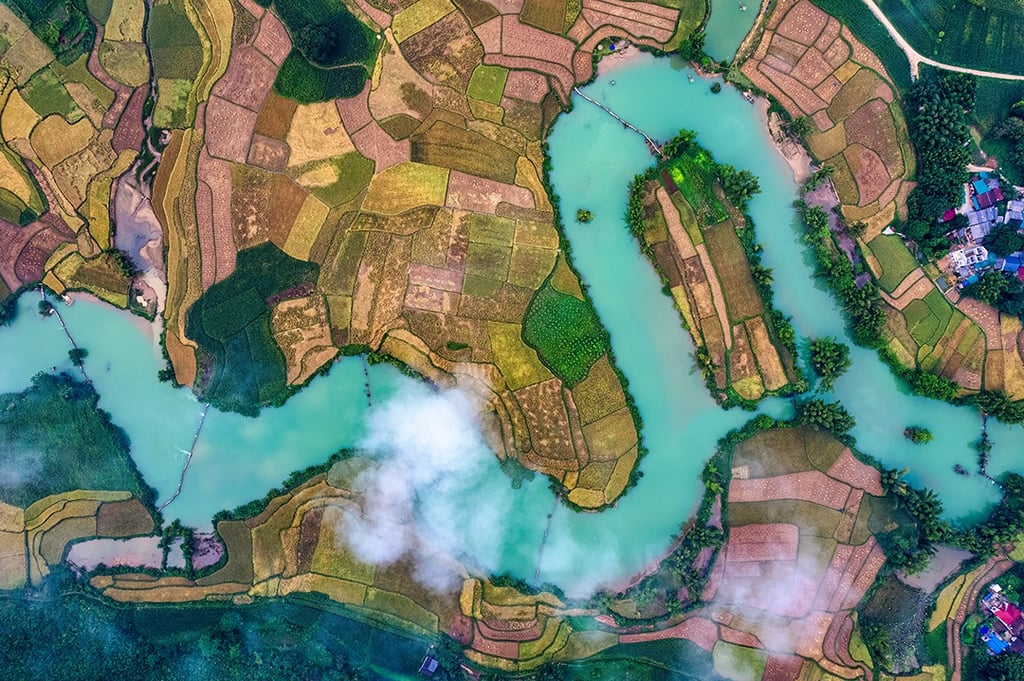
But disease doesn’t occur in a vacuum. The environment shapes it. That’s where Earth observation data comes in. Satellites offer a bird’s-eye view of the conditions that enable disease to spread. Temperature, precipitation, humidity, and land cover are critical variables that can be extracted from Earth-observing satellites.
Additionally, we incorporate demographic and socioeconomic data. Sources like WorldPop or the Relative Wealth Index provide insight into population density, economic conditions, and more, key factors that influence who is most at risk.
Finally, GIS (Geographic Information System) data provides spatial context: proximity to water bodies, access to healthcare facilities, and transportation networks can all impact disease transmission.
Together, these datasets provide a comprehensive snapshot of each location’s vulnerability to disease.
Step 2: Cleaning and Processing the Data

Collecting data is only the beginning. It must be cleaned, aligned, and prepared for machine learning.
This includes:
Cleaning: Removing duplicates, dealing with missing values, and normalizing variables so that machine learning algorithms can learn efficiently.
Standardization: Making sure all datasets use the same units, formats, and time intervals.
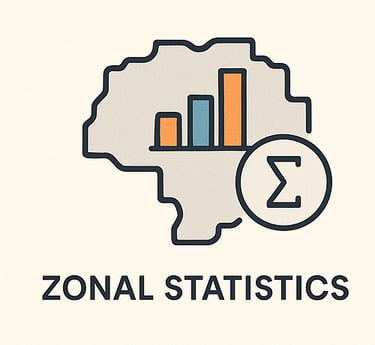
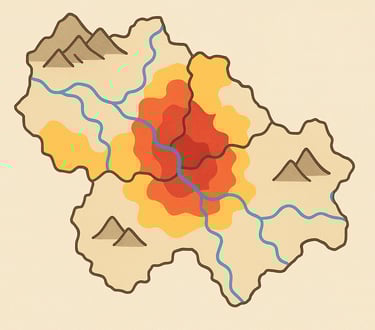
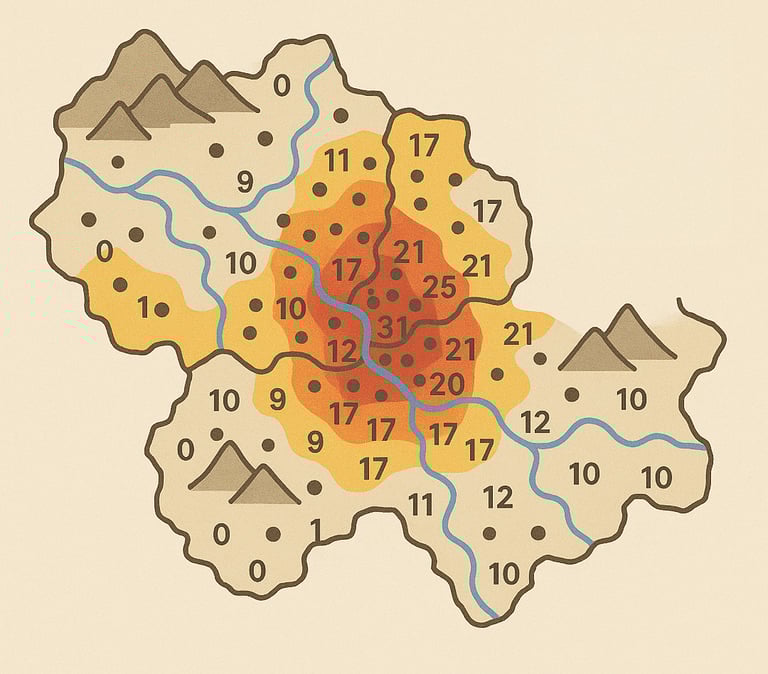
Zonal statistics: Calculating averages or totals within each administrative district. For example, we might compute the mean temperature for each district or the total number of people living near rivers.
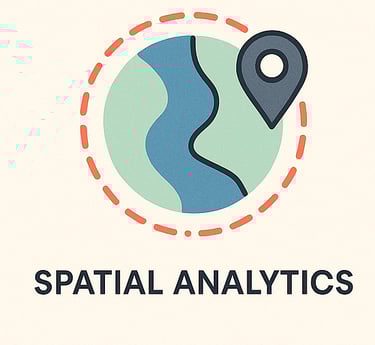
Spatial analytics: Using geospatial techniques like clustering and buffer zones to identify populations within a risk radius of disease-spreading features (e.g., standing water).
At this stage, the data typically appears as a large table. Each row represents a district. Each column is a feature, such as rainfall, vegetation index, or population density.
Step 3: Training the Machine Learning Model
Classification models
Classification models to categorize districts into risk levels (e.g., low, medium, high).

Regression models
Regression models are used to predict the number of expected cases.

Next is the cool part. Using machine learning, we teach the system to recognize patterns in the data and make predictions about future outbreaks. Depending on the problem, we might use:
To accelerate and streamline this process, I've used AutoML tools such as AutoGluon, Auto-Sklearn, AutoKeras, and Auto PyTorch. These libraries handle model selection, hyperparameter tuning, and feature preprocessing automatically, an incredible time-saver when working with large, diverse datasets.
Beyond just predictions, machine learning models offer interpretability. For example, a model might reveal that districts with high precipitation and poor sanitation are consistently hotspots for cholera outbreaks. These insights are as valuable as the predictions themselves.
Step 4: Evaluating the Model
After training the model, we must evaluate its performance to ensure accuracy and reliability.
Balance precision and recall
Ensure accuracy and reliability
For regression problems, we use metrics like Root Mean Squared Error (RMSE) to measure how closely predictions match actual values.
For classification problems, we use metrics like the F1 Score, which balances precision and recall to effectively handle both classes, such as high and low cases.
A proper train-test split ensures the model isn’t overfitting and performs well on new data. Evaluation helps us understand how well the model works, and through the errors, highlights areas for improvement, such as adding more data or refining features.
Step 5: Interpretation and Iteration
This step is about making sense of the results and refining the process for interpretation and iteration.
Feature Importance analysis identifies which features had the most impact on predictions. SHAP values are another method with a similar goal. These can be used to identify critical factors for disease spread, such as temperature or the population near water.


Explainable AI (XAI) turns black-box predictions into trusted insights—because decision-makers don’t just need answers, they need to understand why.
With this new knowledge, we can return to the data collection step, add new variables, and retrain the model to improve its accuracy, repeating the process.
This iterative process helps us build models that are not only accurate but also insightful and generalizable, providing actionable information for public health decisions.
Benefits of This Approach
Using machine learning with Earth observation data offers several key benefits:
First, this proactive approach to public health enables us to anticipate and prepare in advance, rather than reacting to outbreaks.
Second, decision-makers can target interventions, such as vaccines or sanitation efforts, for efficient resource allocation in high-risk areas.
Third, this approach is applicable across various diseases and regions, making it scalable and adaptable to diverse public health challenges.
Fourth, with a trained model, we can run simulations to explore scenarios, such as how a one-degree temperature increase might affect malaria cases or how improved water sanitation could reduce cholera outbreaks.
Other potential applications of this approach
Combining Earth observation and demographic data with machine learning can be applied to various challenges far beyond disease prediction. For example, it can help mitigate urban heat islands by identifying vulnerable neighborhoods using temperature and land cover data, thereby guiding cooling initiatives such as tree planting. It can also enhance food security by predicting crop yields based on vegetation indices, precipitation, and soil moisture, enabling more effective resource allocation and early warnings of potential food shortages.
Other applications include disaster preparedness, where satellite data helps map floodplains or wildfire-prone areas. Demographic data helps identify at-risk populations, enabling more effective evacuation and aid strategies. Satellite data can also monitor air pollution and predict health risks, enabling targeted interventions to protect vulnerable groups. Ultimately, this process can facilitate equitable infrastructure development by examining access to roads, schools, and healthcare facilities, thereby ensuring that underserved areas receive the necessary investments.
Conclusion and Call to Action
And there you have it. A step-by-step look at how machine learning and Earth observation data can be used to predict and prevent disease outbreaks. This process combines advanced technology with public health insights, creating tools to make a real difference in people’s lives.
I'd love to hear if this inspires you or if you’d like to collaborate on similar projects. Together, we can push the boundaries of what’s possible and work toward a healthier, more resilient world.
Thanks for reading. In a future post, I will provide more technical details on various ways to set up a machine learning problem than I described here, including what worked and what didn't work for me in predicting disease outbreaks, as well as potential extensions of this research.
See you then!
If you care about the future of health, climate, or technology, missing this video means missing the blueprint for solving some of today’s biggest challenges.
