Satellite Data for Monitoring Harmful Algal Blooms
In this post, I explore the innovative use of satellite data and the Surface Algal Bloom Index (SABI) to monitor harmful algal blooms (HABs). Initially applied to the Arabian Gulf, the method was scaled globally using NASA's MODIS data from 2020 to February 2023. The project demonstrates the power of satellite data analysis and geospatial monitoring in detecting and visualizing HABs, providing a cost-effective supplement or complement to traditional in-situ measurements. By creating detailed visualizations, the project underscores the potential for scalable environmental monitoring solutions that support public health and sustainable development. Future directions include integrating AI for predictive analysis, developing real-time monitoring systems, and enhancing data accuracy through collaborative research.
TECH FOR PUBLIC HEALTHSCIENTIFIC INSIGHTS INTO AI AND GEOSPATIAL TECHNOLOGIES
Scott Pezanowski
7/28/20246 min read
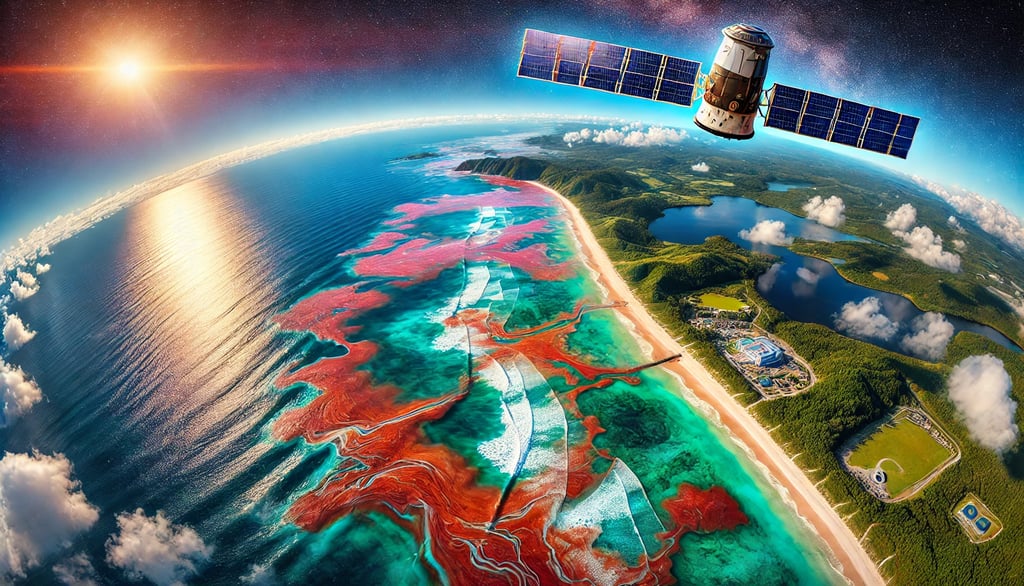
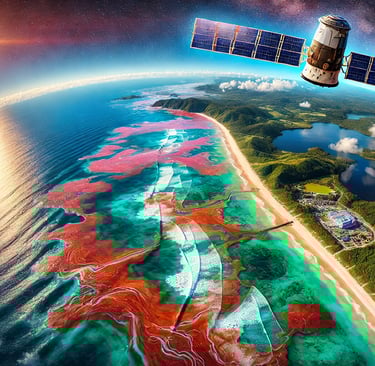
Harmful algal blooms can wreak havoc on fisheries and coastal economies – learn how satellite monitoring can help combat this silent threat. These blooms can deplete oxygen in the water, release toxins harmful to aquatic life and humans, and disrupt water ecosystems. Kuwait is particularly vulnerable with its extensive coastline and reliance on fishing and desalination technology. The Surface Algal Bloom Index (SABI)(Alawadi, F. 2010) provides a simple method to monitor these blooms using satellite data. It is inspired by the respected Normalized Difference Vegetation Index (NDVI). Leveraging the SABI index, I applied it to the Arabian Gulf and then scaled it to a global level using NASA's MODIS data from 2020 to February 2023.
Local Monitoring in Kuwait
In my initial work, inspired by Sid S's application of the SABI index to detect harmful algal blooms near Mumbai, India (S., S. 2020), I adapted his code to monitor the Arabian Gulf. This region is vital for Kuwait's fishing industry and desalination plants, making early detection of HABs vital.
I created a weekly timelapse video using NASA's MODIS data that visualizes potential algal blooms around Kuwait from 2020 to early 2023. The implementation involved several key steps:
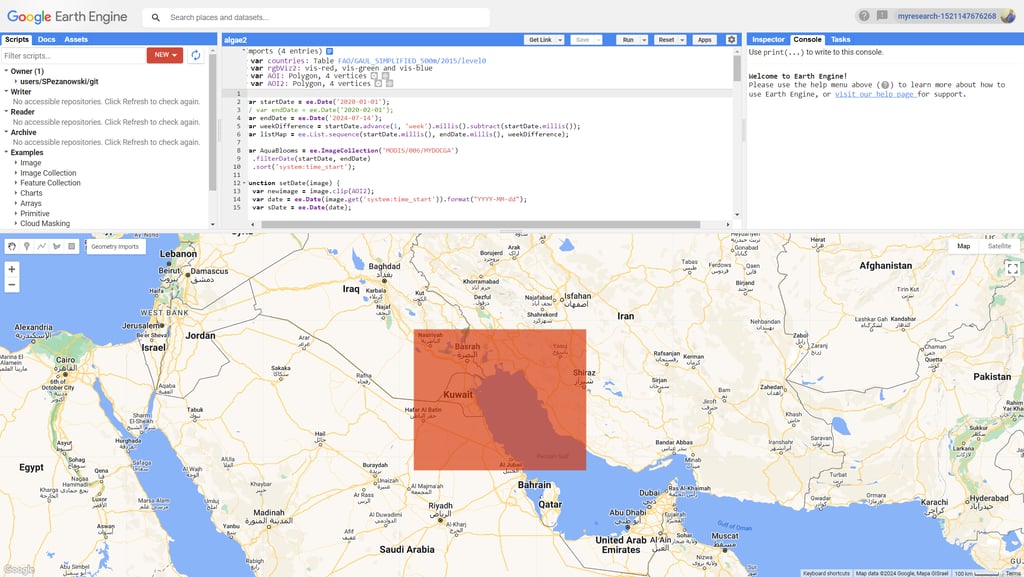
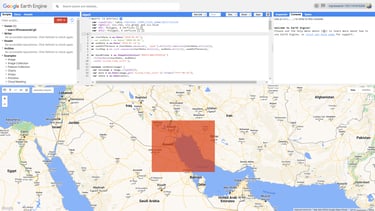
Defining the area of interest (AOI): I used Google Earth Engine (GEE) to define an AOI around the Kuwaiti coastline.
Applying the SABI Index: The SABI Index was used to MODIS Aqua imagery. The index highlights areas with high algal concentrations by detecting the 'red-edge' effect—where the most significant reflectance slope occurs between maximum absorption in the red band and maximum reflection in the near-infrared band of the electromagnetic spectrum.
Creating a visualization: I processed the MODIS data to create a false-color composite that visually highlights algal blooms. The final visualization showcases these blooms as reddish areas, distinguishing them from other features like sediments.
This localized monitoring provides invaluable insights for Kuwait, offering a low-cost, scalable supplement to traditional in-situ measurements.
GEE provides a JavaScript code editor that you see above where I wrote the code.
Select the MODIS data for the time frame and AOI
Loop through every week during that period
Select the MODIS image pixels for that week until I have as complete an image as possible
Select the MODIS bands needed for SABI
Apply the SABI index pixel calculations to the selected bands
Visualize the resulting values using an appropriate color scheme
Export all weekly results as an animated video.


Local Algal Blooms
Check out the video animation of the results to see SABI in action near Kuwait in the Arabian Gulf.
Reach out to learn how I can help you monitor HABs in your area or scale up your environmental monitoring challenges.

Scaling to Global Monitoring
Building on the local monitoring project's success, I extended the SABI index's application to a global scale. The goal was to monitor HABs worldwide, using the same methods and datasets, thereby contributing to a broader understanding and early warning system for HABs.
Global data processing: By expanding the AOI to cover the entire globe, I applied the SABI index to MODIS Aqua imagery for the same period (2020 to February 2023). This expansion involved handling significantly larger datasets and ensuring the index's robustness across diverse marine environments.
Temporal analysis: The global analysis also incorporated a temporal dimension, examining changes in algal bloom patterns over the three years. This temporal analysis can reveal trends and seasonal variations in HAB occurrences.
Detailed regional focus: I highlighted the Red Sea in the video in the global dataset as an inset to illustrate more detailed insights. This regional focus helps validate the worldwide model and provides actionable information for local stakeholders.

Check out the video animation for the automated global detection of HABs. The inset shows the Red Sea area to illustrate detail.
To see how AI can scale your datasets from local to global, or add local detail, see my use case.
The Science Behind the Detection
The SABI index is rooted in algae's optical properties. Algae can regulate their buoyancy to optimize light absorption for photosynthesis, exhibiting a 'red-edge' effect in satellite imagery. This effect is characterized by a sharp increase in reflectance in the near-infrared region of the electromagnetic spectrum captured by the MODIS sensors.
Critical steps in the data processing include:
Image collection: Retrieving MODIS Aqua images from the GEE platform.
False-color composite: Creating a false-color composite using specific MODIS bands (15, 14, 13) to highlight algal blooms.
Index calculation: Calculating the SABI index to identify areas with high algal concentration.
Masking and filtering: Applying quality control masks to filter out noise from clouds and other atmospheric artifacts.
These steps ensure that the resulting visualizations accurately represent areas affected by harmful algal blooms. Additionally, because SABI is only a mathematical formula applied to pixel values, global index calculations are highly efficient.
Visualization and Outreach
You didn’t come this far to stop
I created timelapse videos for the Kuwaiti coastline, the Red Sea, and the global dataset to communicate the findings effectively. These videos show the dynamic nature of algal blooms over time, making the data accessible and engaging for a broader audience.
This post aims to raise awareness about satellite data's potential for environmental monitoring and invite collaboration from researchers, institutions, and policymakers.
I welcome collaborations where we can validate, expand, and improve the results I show.
Future Directions
The success of this project opens several avenues for further research and application:
Machine learning integration: Incorporating AI and machine learning techniques to improve algal bloom detection's accuracy and predictive capabilities. Training models on past bloom events can help predict future occurrences using supervised machine learning.
Real-Time monitoring and alerts: Developing a real-time monitoring system that provides alerts for harmful algal blooms. Such a system can support proactive decision-making and mitigate the impacts of HABs on marine ecosystems and human health.
Enhanced data analysis: We can extend the analysis to other satellite datasets, such as Sentinel-3, to improve spatial and temporal resolution. Combining data from multiple sources can provide a more comprehensive view of algal bloom dynamics.
Collaborative research: Engaging with local and international research institutions, such as the Kuwait Institute for Scientific Research (KISR), Kuwait Foundation for the Advancement of Sciences (KFAS), Kuwait University, or equivalent institutions in Qatar, Bahrain, Saudi Arabia, Oman, or the United Arab Emirates to validate and enhance the methodology.
Conclusion
The application of the SABI index to monitor harmful algal blooms demonstrates the power of satellite data and geospatial analytics in addressing environmental challenges. From local monitoring in Kuwait to global-scale analysis, this project highlights the potential for scalable, cost-effective solutions to support public health, marine ecosystems, and sustainable development.
By leveraging advancements in remote sensing, data analytics, and collaborative research, we can build a more resilient and informed response to the threats posed by harmful algal blooms. The journey from local to global monitoring is just the beginning—there are endless possibilities for innovation and impact in environmental monitoring.
Call to Action
I invite researchers, policymakers, and stakeholders to join me in this effort. Let's engage, collaborate, and contribute to the future of public health technology. Together, we can harness the power of geospatial data to protect our oceans and communities from the dangers of harmful algal blooms.


”[Scott] is one of the hardest workers I have worked with. Needless to say, he has excellent technical skills, grasp of the market, and while one can never predict the future, a great understanding of where the field, especially geospatial artificial intelligence, may be going with its promise and its perils.”
- Professor Dr. Prasenjit Mitra | The College of Information Sciences and Technology, The Pennsylvania State University


References
Alawadi, F. (2010). Detection of surface algal blooms using the newly developed algorithm surface algal bloom index (SABI). In C. R. B. Jr., S. P. Mertikas, X. Neyt, & M. Velez-Reyes (Eds.), Remote Sensing of the Ocean, Sea Ice, and Large Water Regions 2010 (Vol. 7825, p. 782506). SPIE. https://doi.org/10.1117/12.862096
S., S. (2020, October 12). Harmful Algal Bloom detection with MODIS Aqua Imagery using Google Earth Engine. Medium. https://sid-write.medium.com/harmful-algal-bloom-detection-with-modis-aqua-imagery-using-google-earth-engine-2210706b7141